|
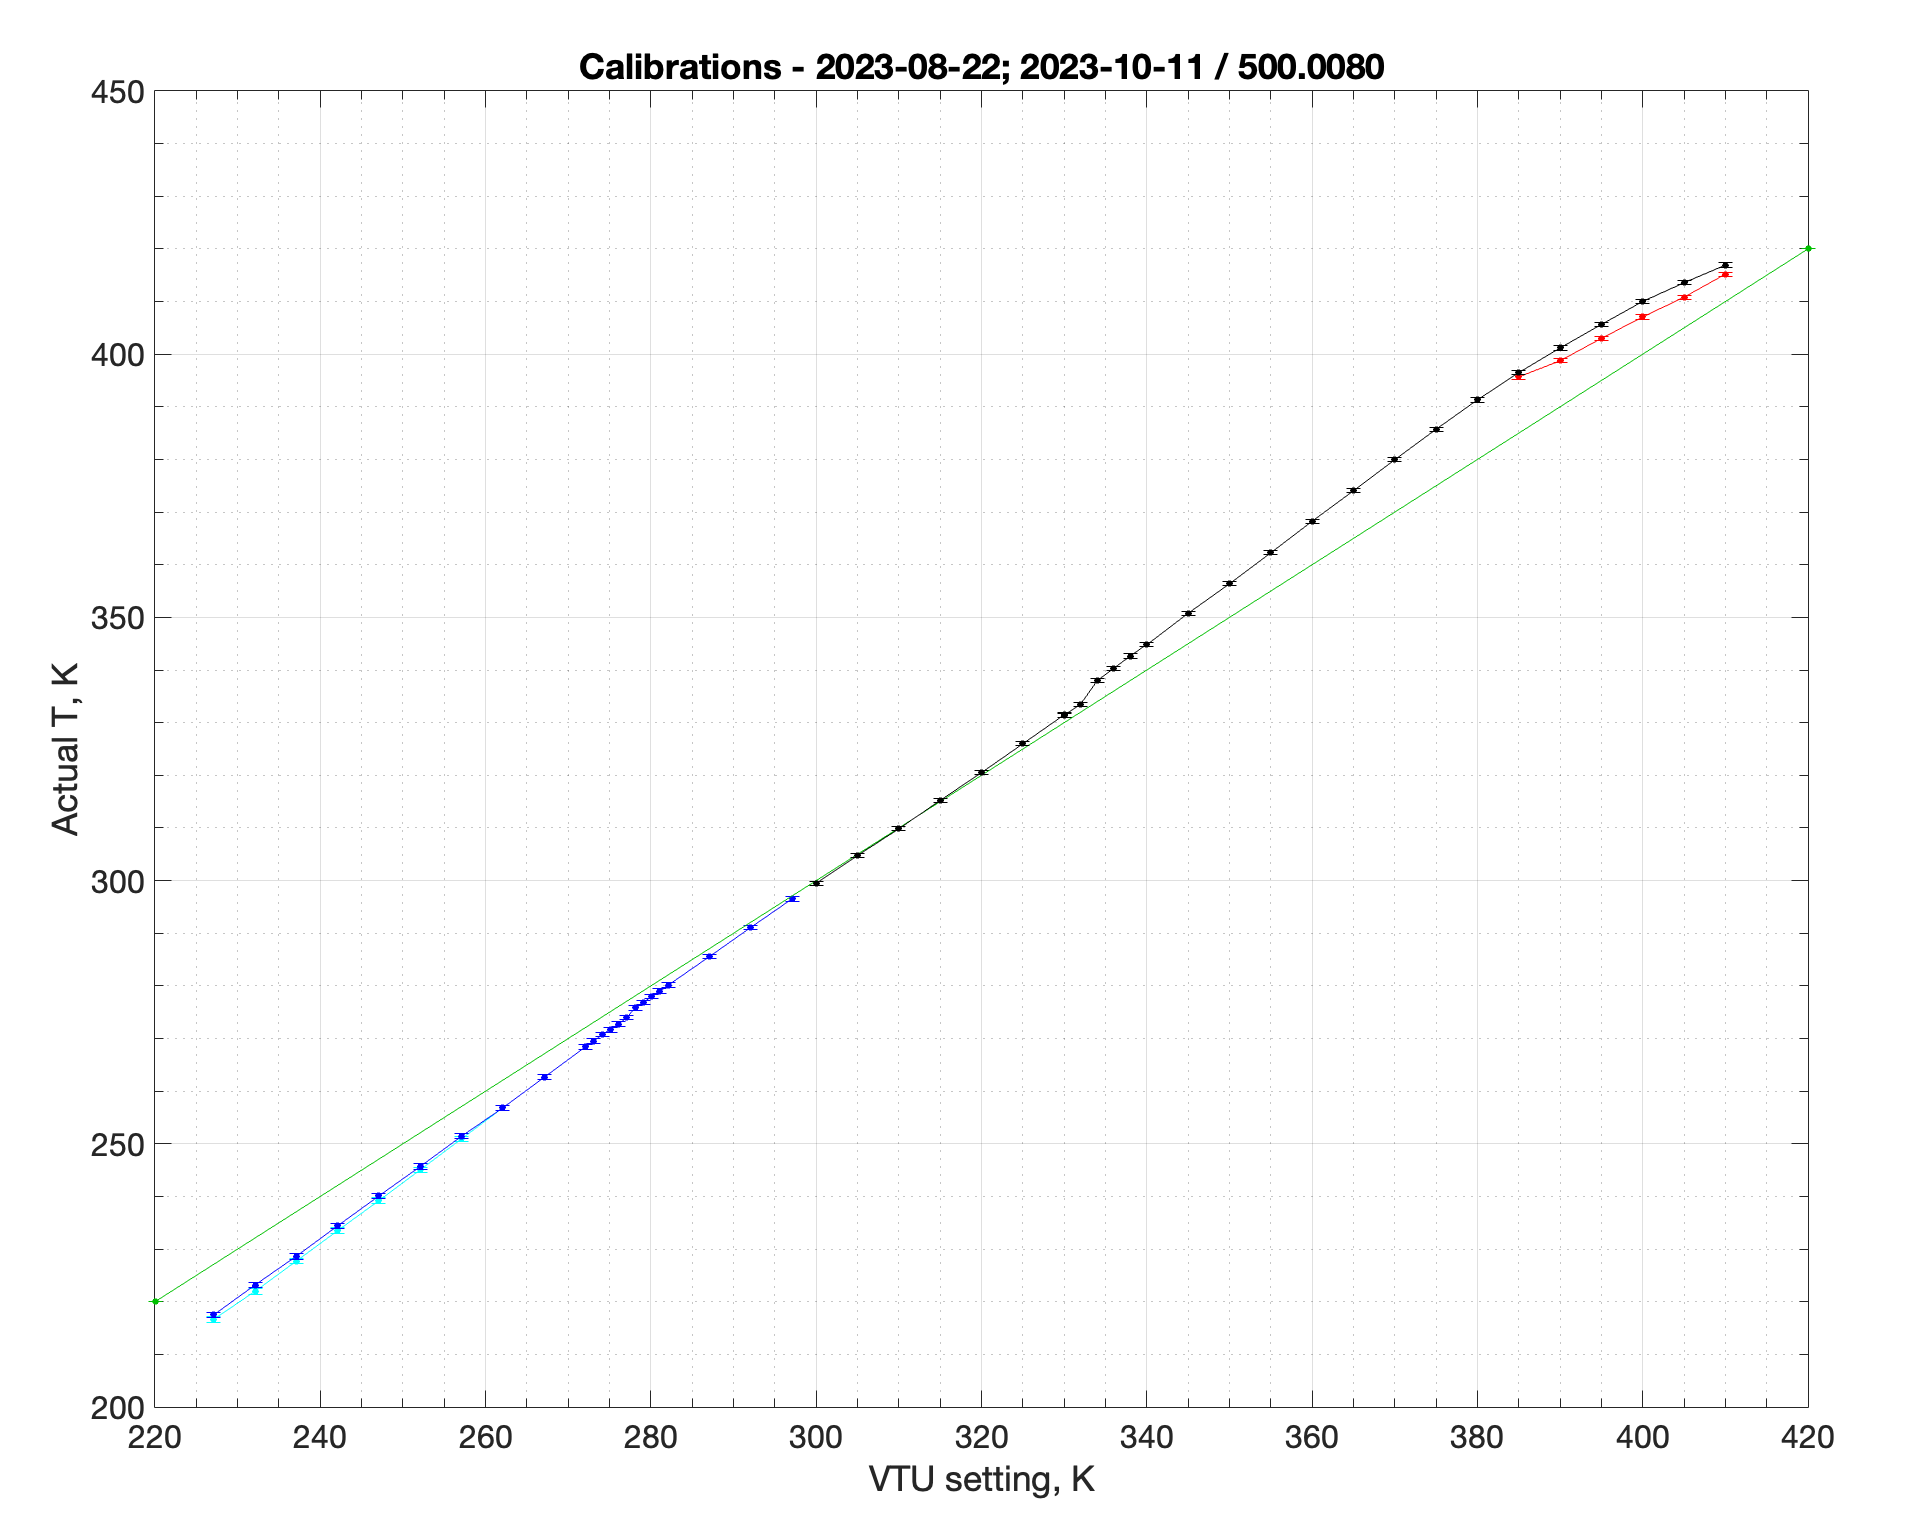
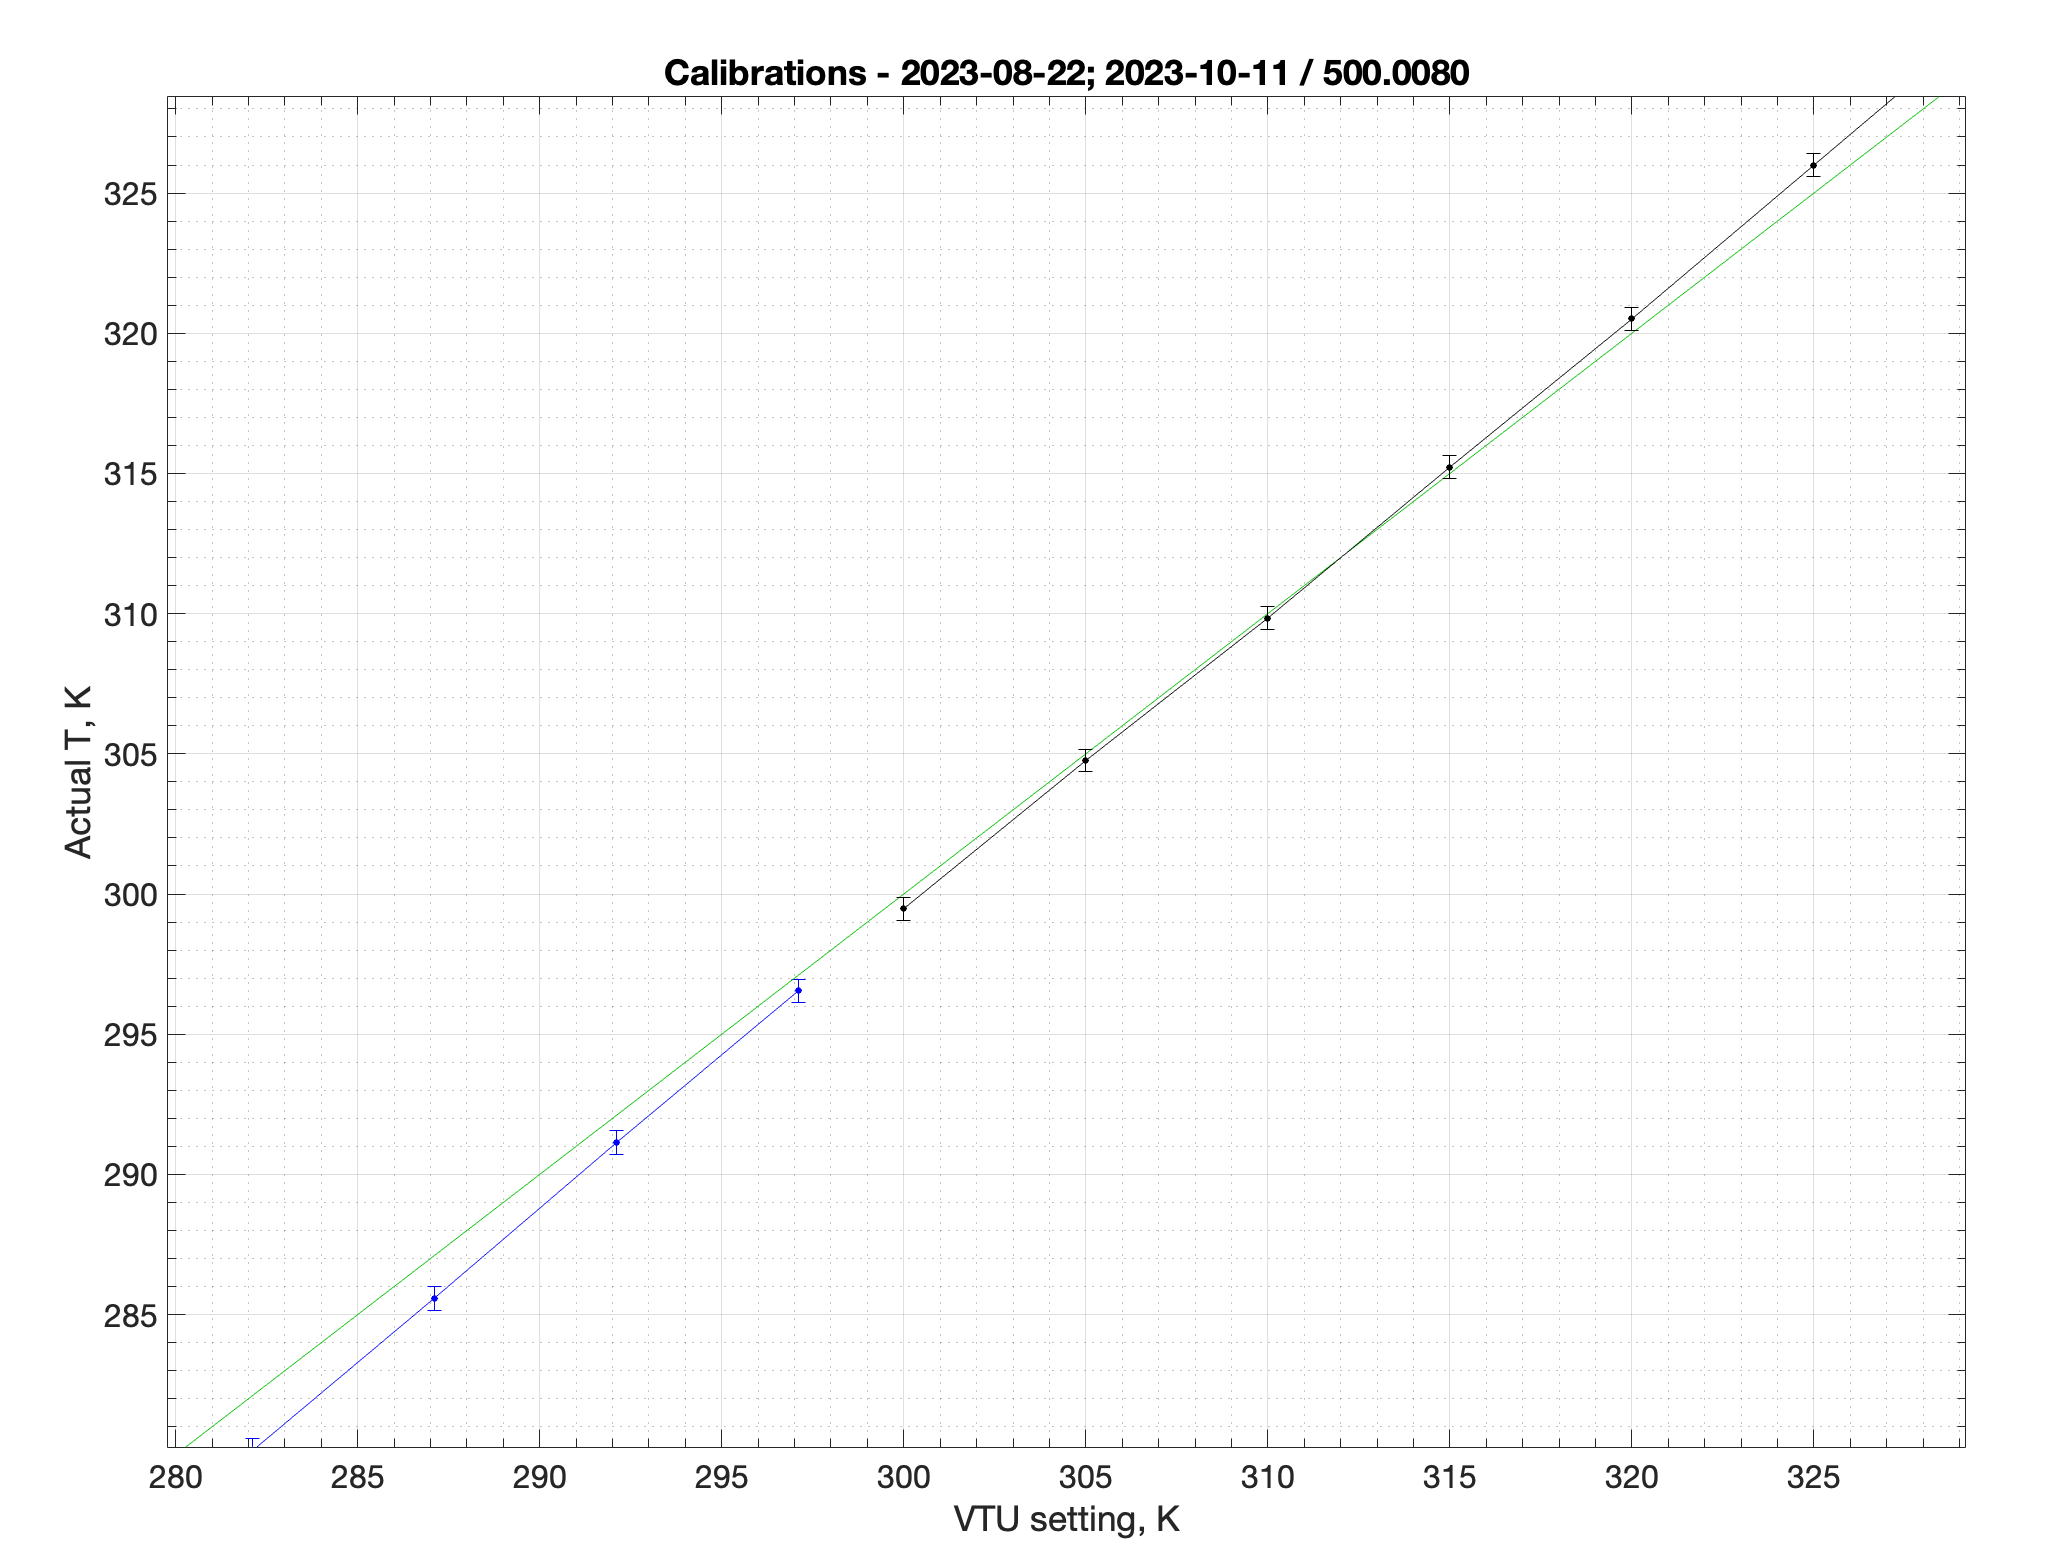
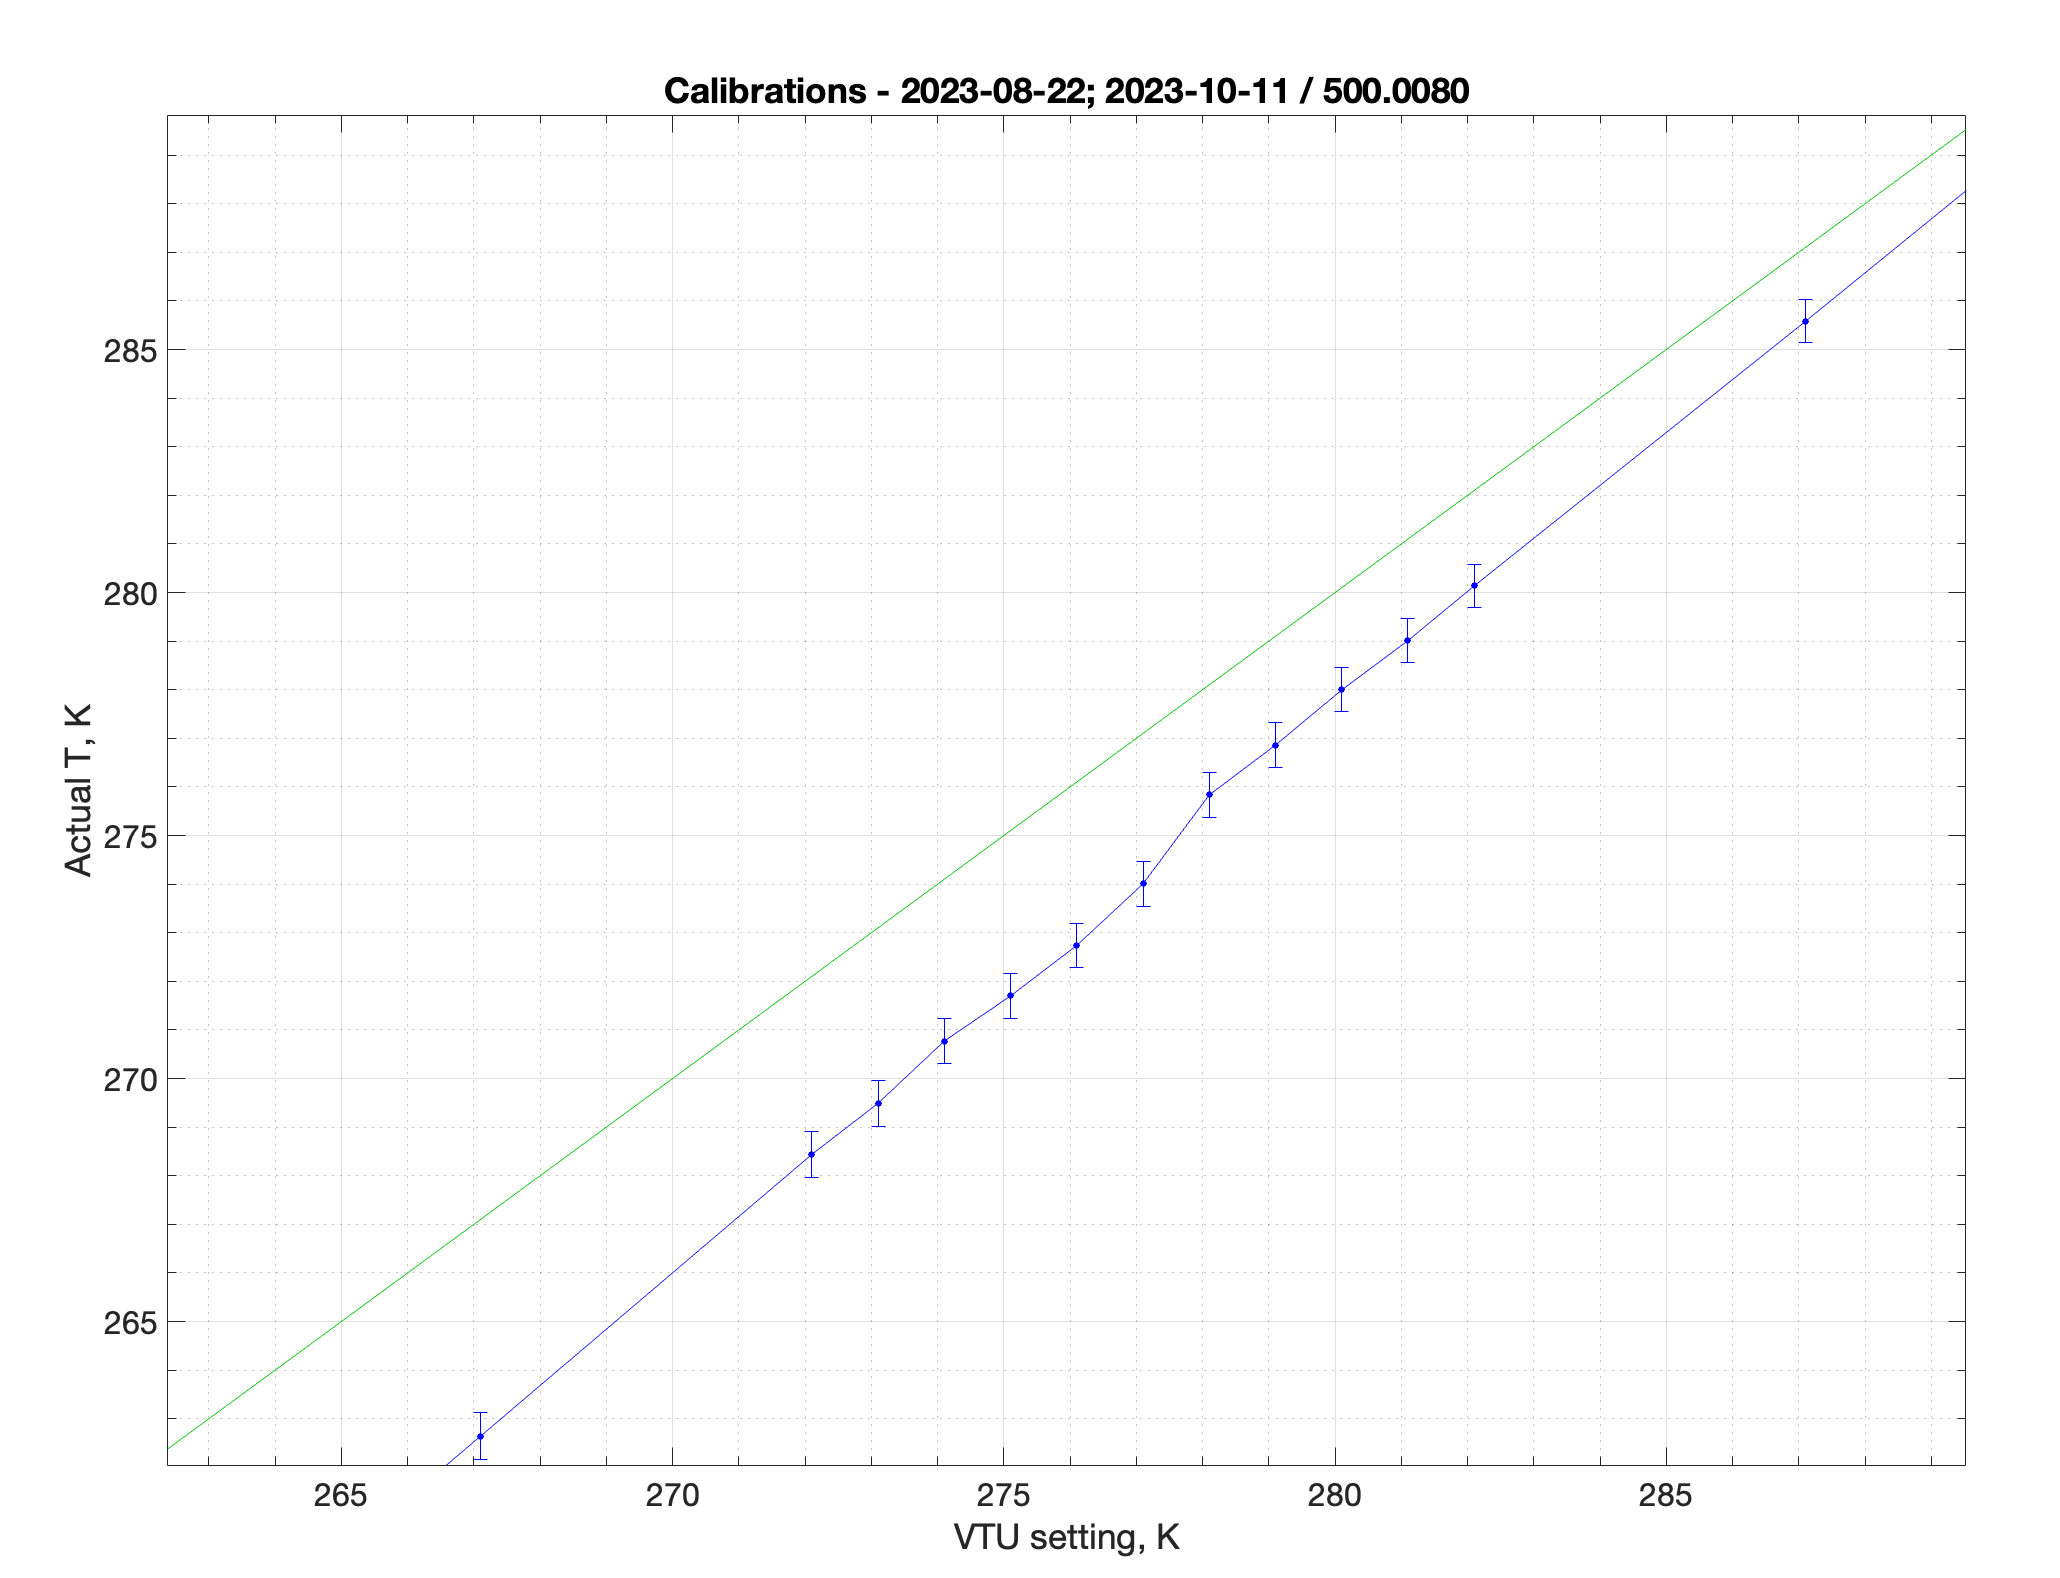
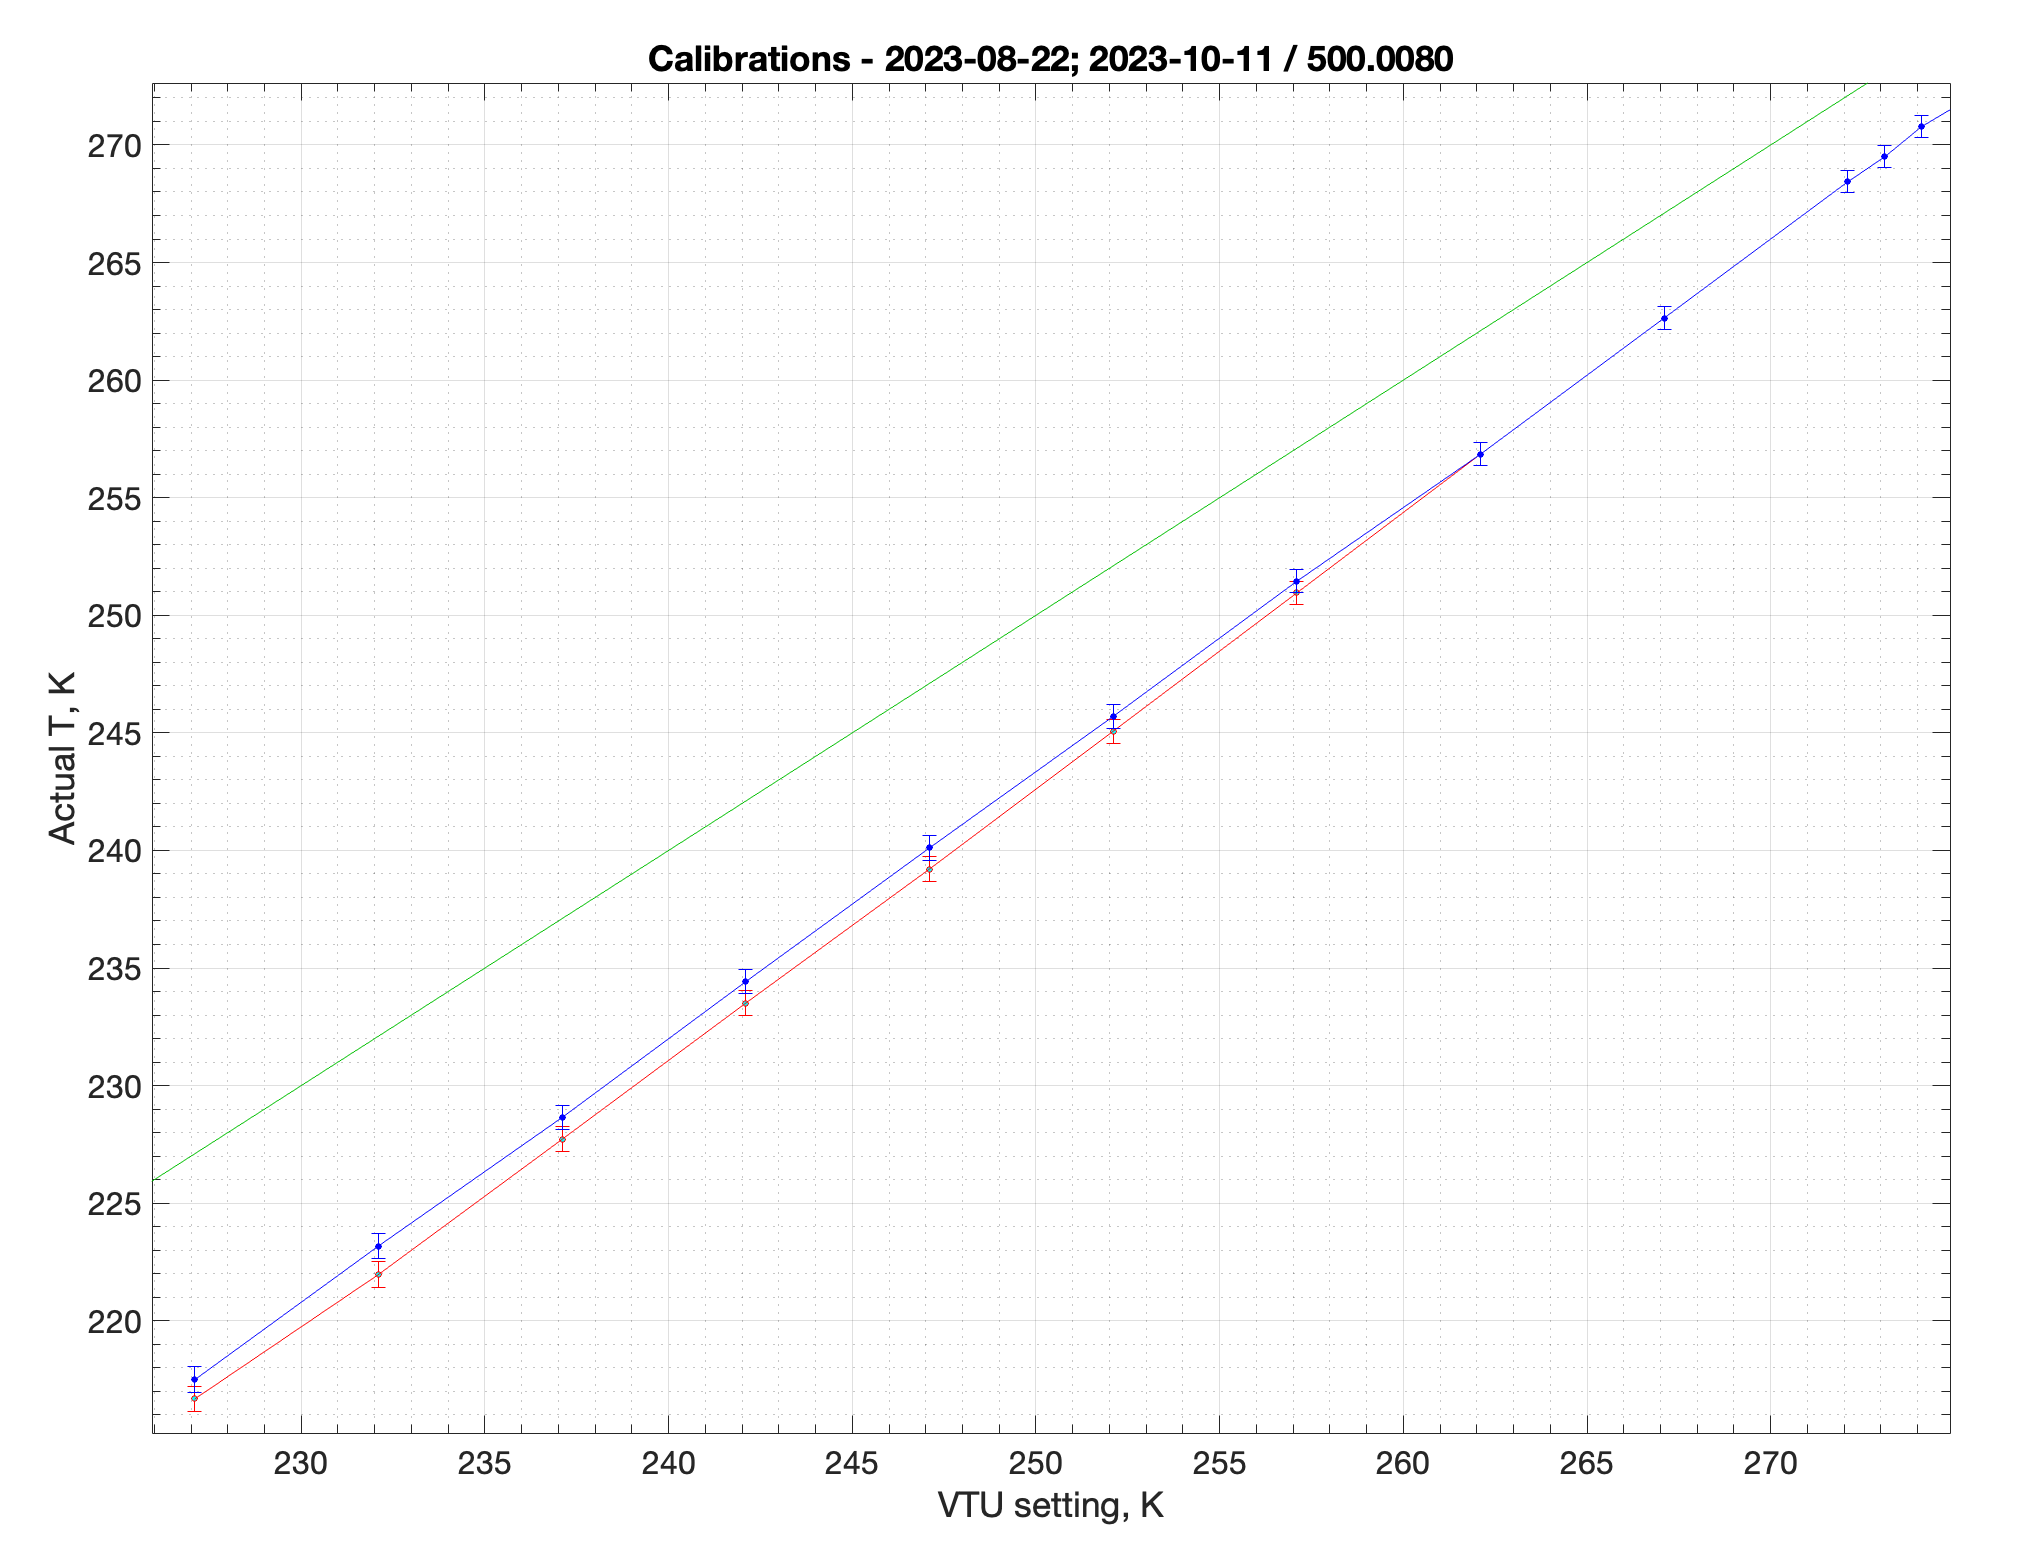
Below you will find overview graphs as well as graphs zoomed into specific regions. Please, use zoomed graphs for more accurate calibrations. Black and blue points are measurements to use.
These calibrations were obtained in August and October of 2023 for McCourtney 500 with automatic BCU-II chiller and Z119470_0080 probe (spare500 BBFO) by EK. The original data are in /Notre Dame NMR suite/Development/KovriginNMR/EK430.Temperature_Calibrations.500.0080.spare
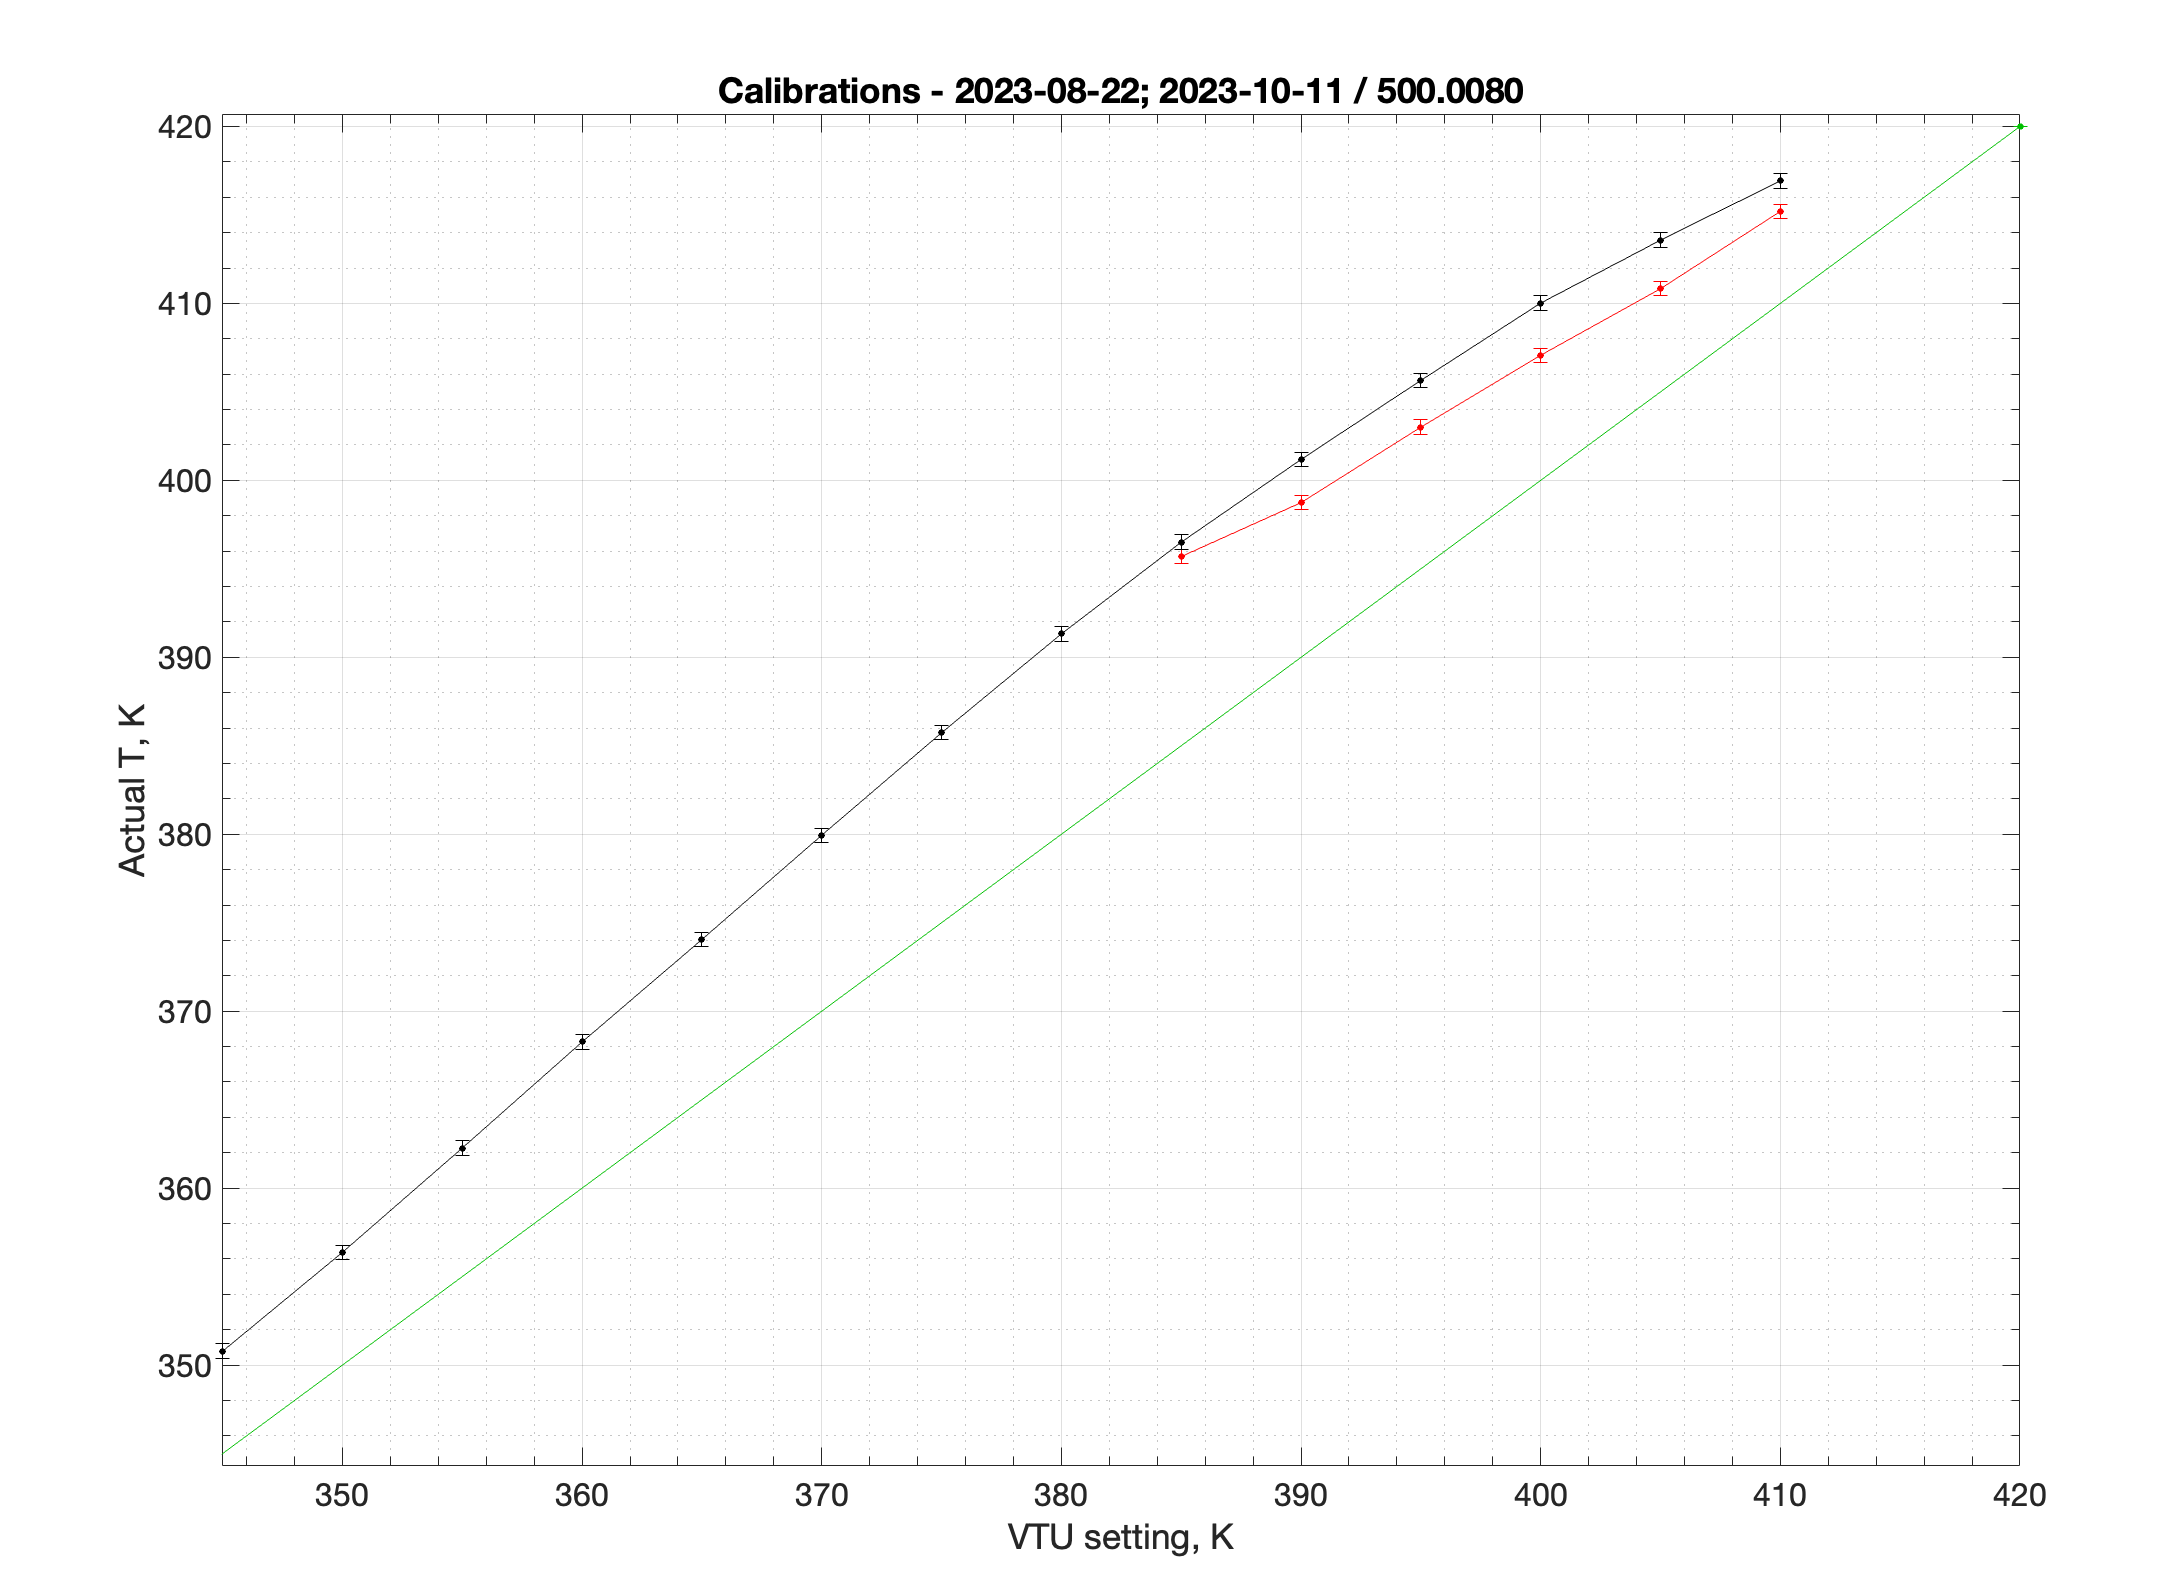
Red points on high-temp end: position of the left downfield peak of ethylene glycol after the downfield peak splits above VTU=380. I believe the right downfield peak (black points) should be used as a calibration because it is a smoother function of VTU.
Cyan points on the low-temp end: the upfield methanol peak splits below 260; the difference in calculated temperaturs is one degree. Choose the middle point between the two for your real temperature reading.
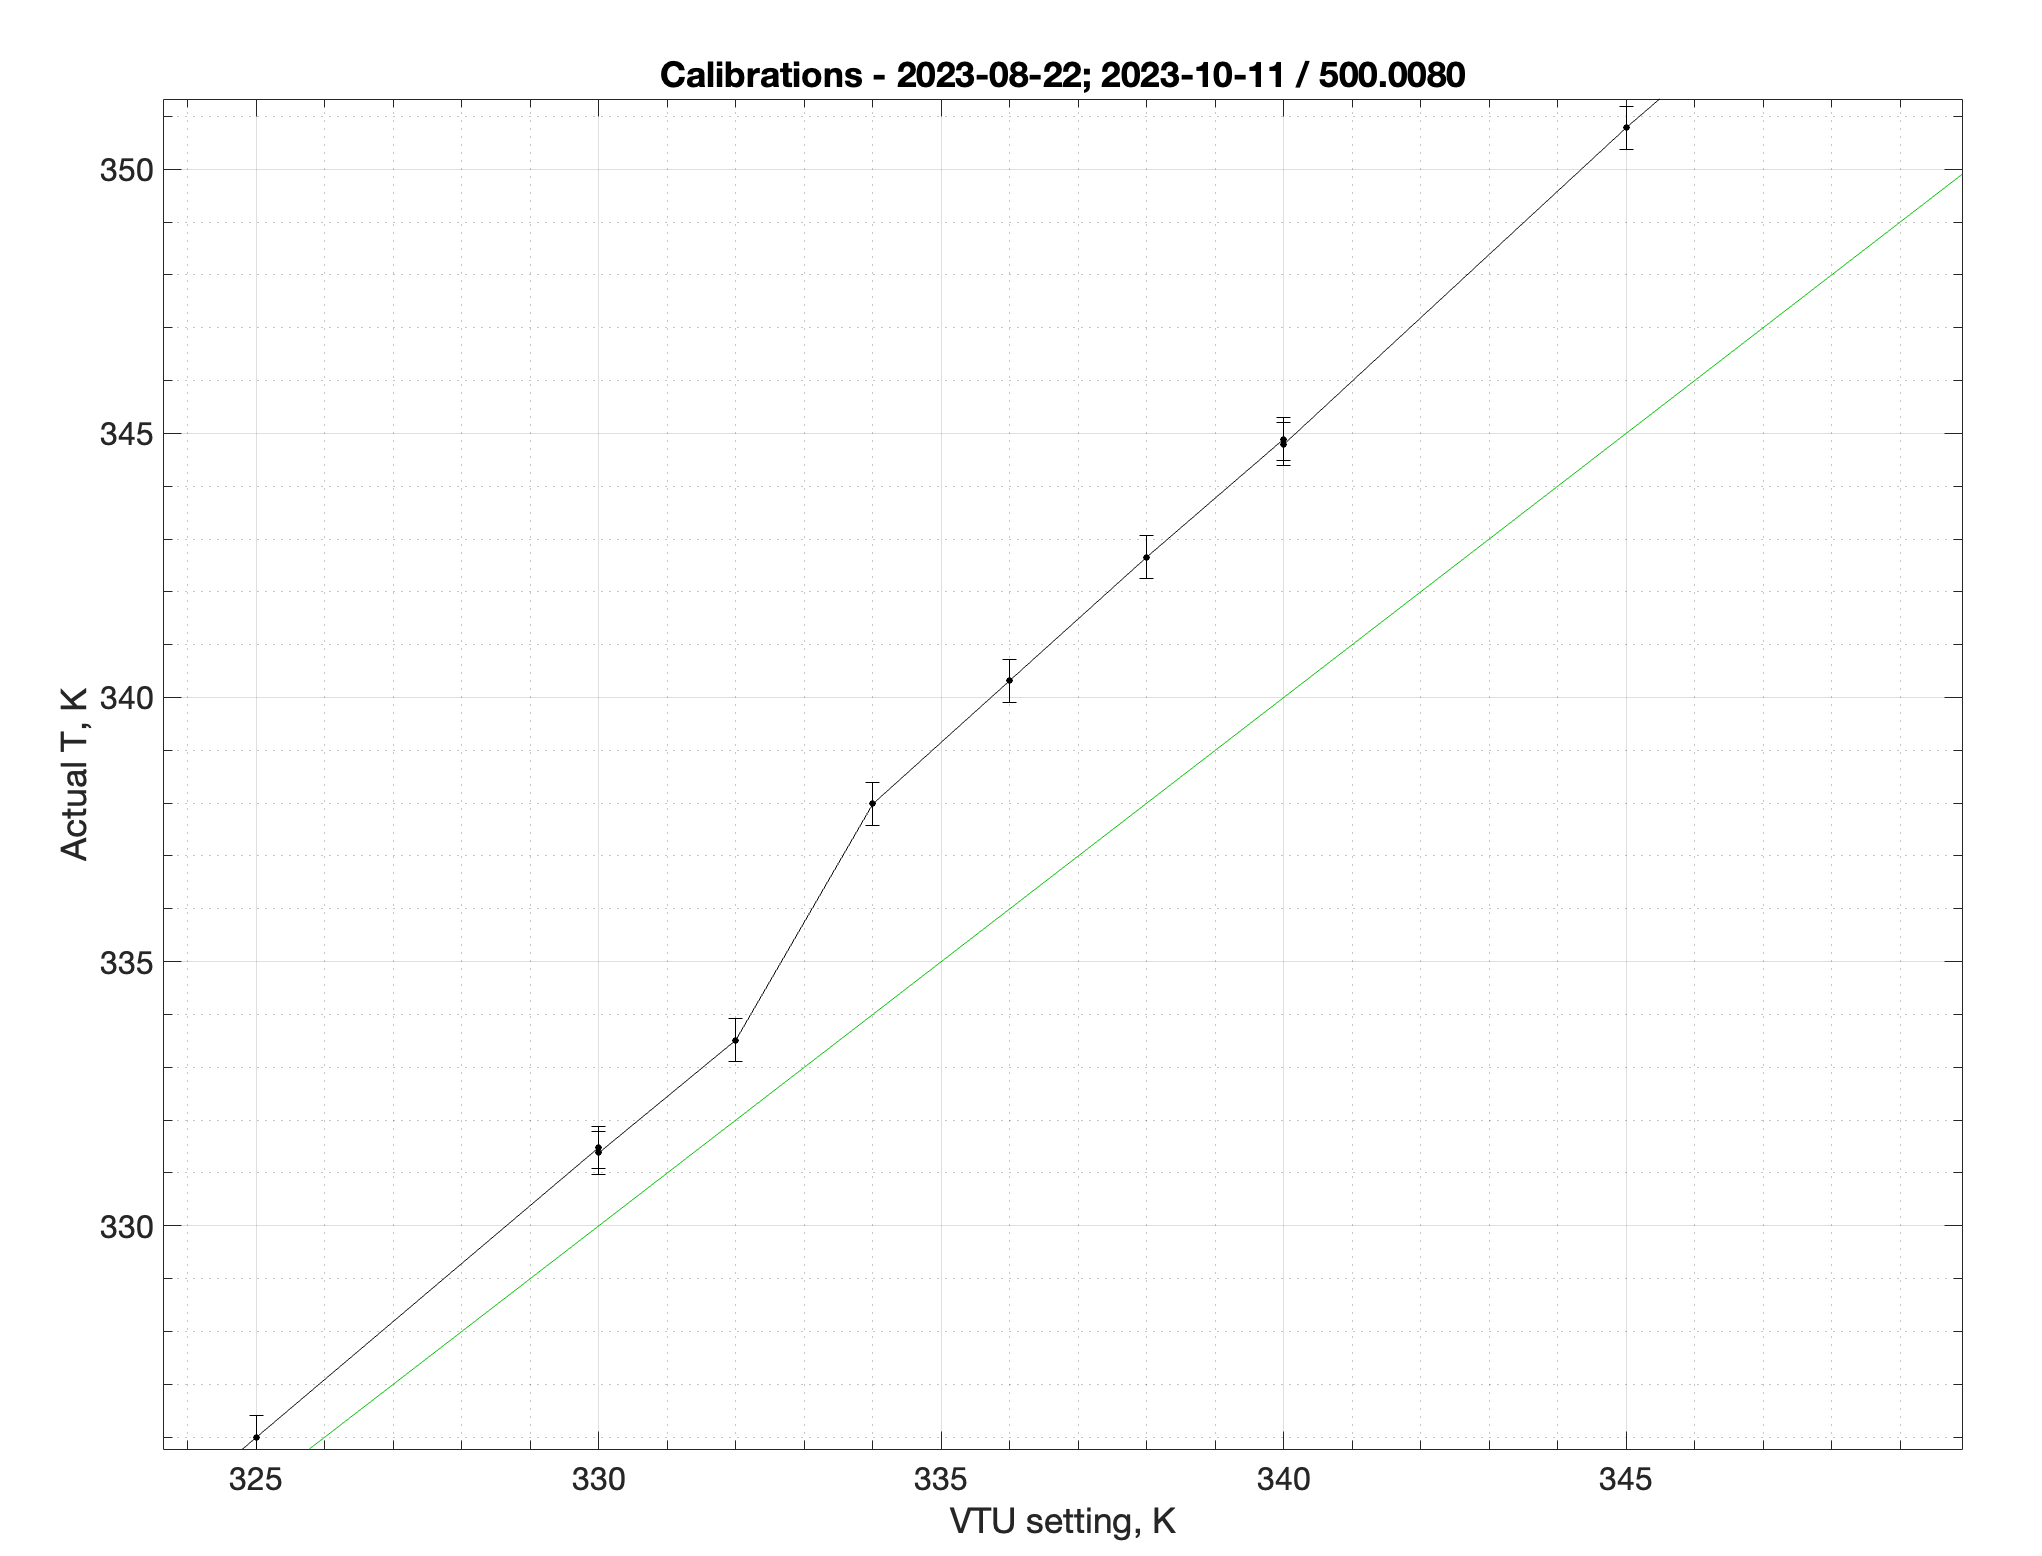
Green line: reference 1:1 line to guide an eye
Red points on high-temp end: position of the left downfield peak of ethylene glycol after the downfield peak splits above VTU=380. I believe the right downfield peak (black points) should be used as a calibration because it is a smoother function of VTU.
McCourtney 500: High-temperature no-trust regionVTU = 332 to 334, which results in a "dead region" of inaccessible T (real) = 333 K to 338K
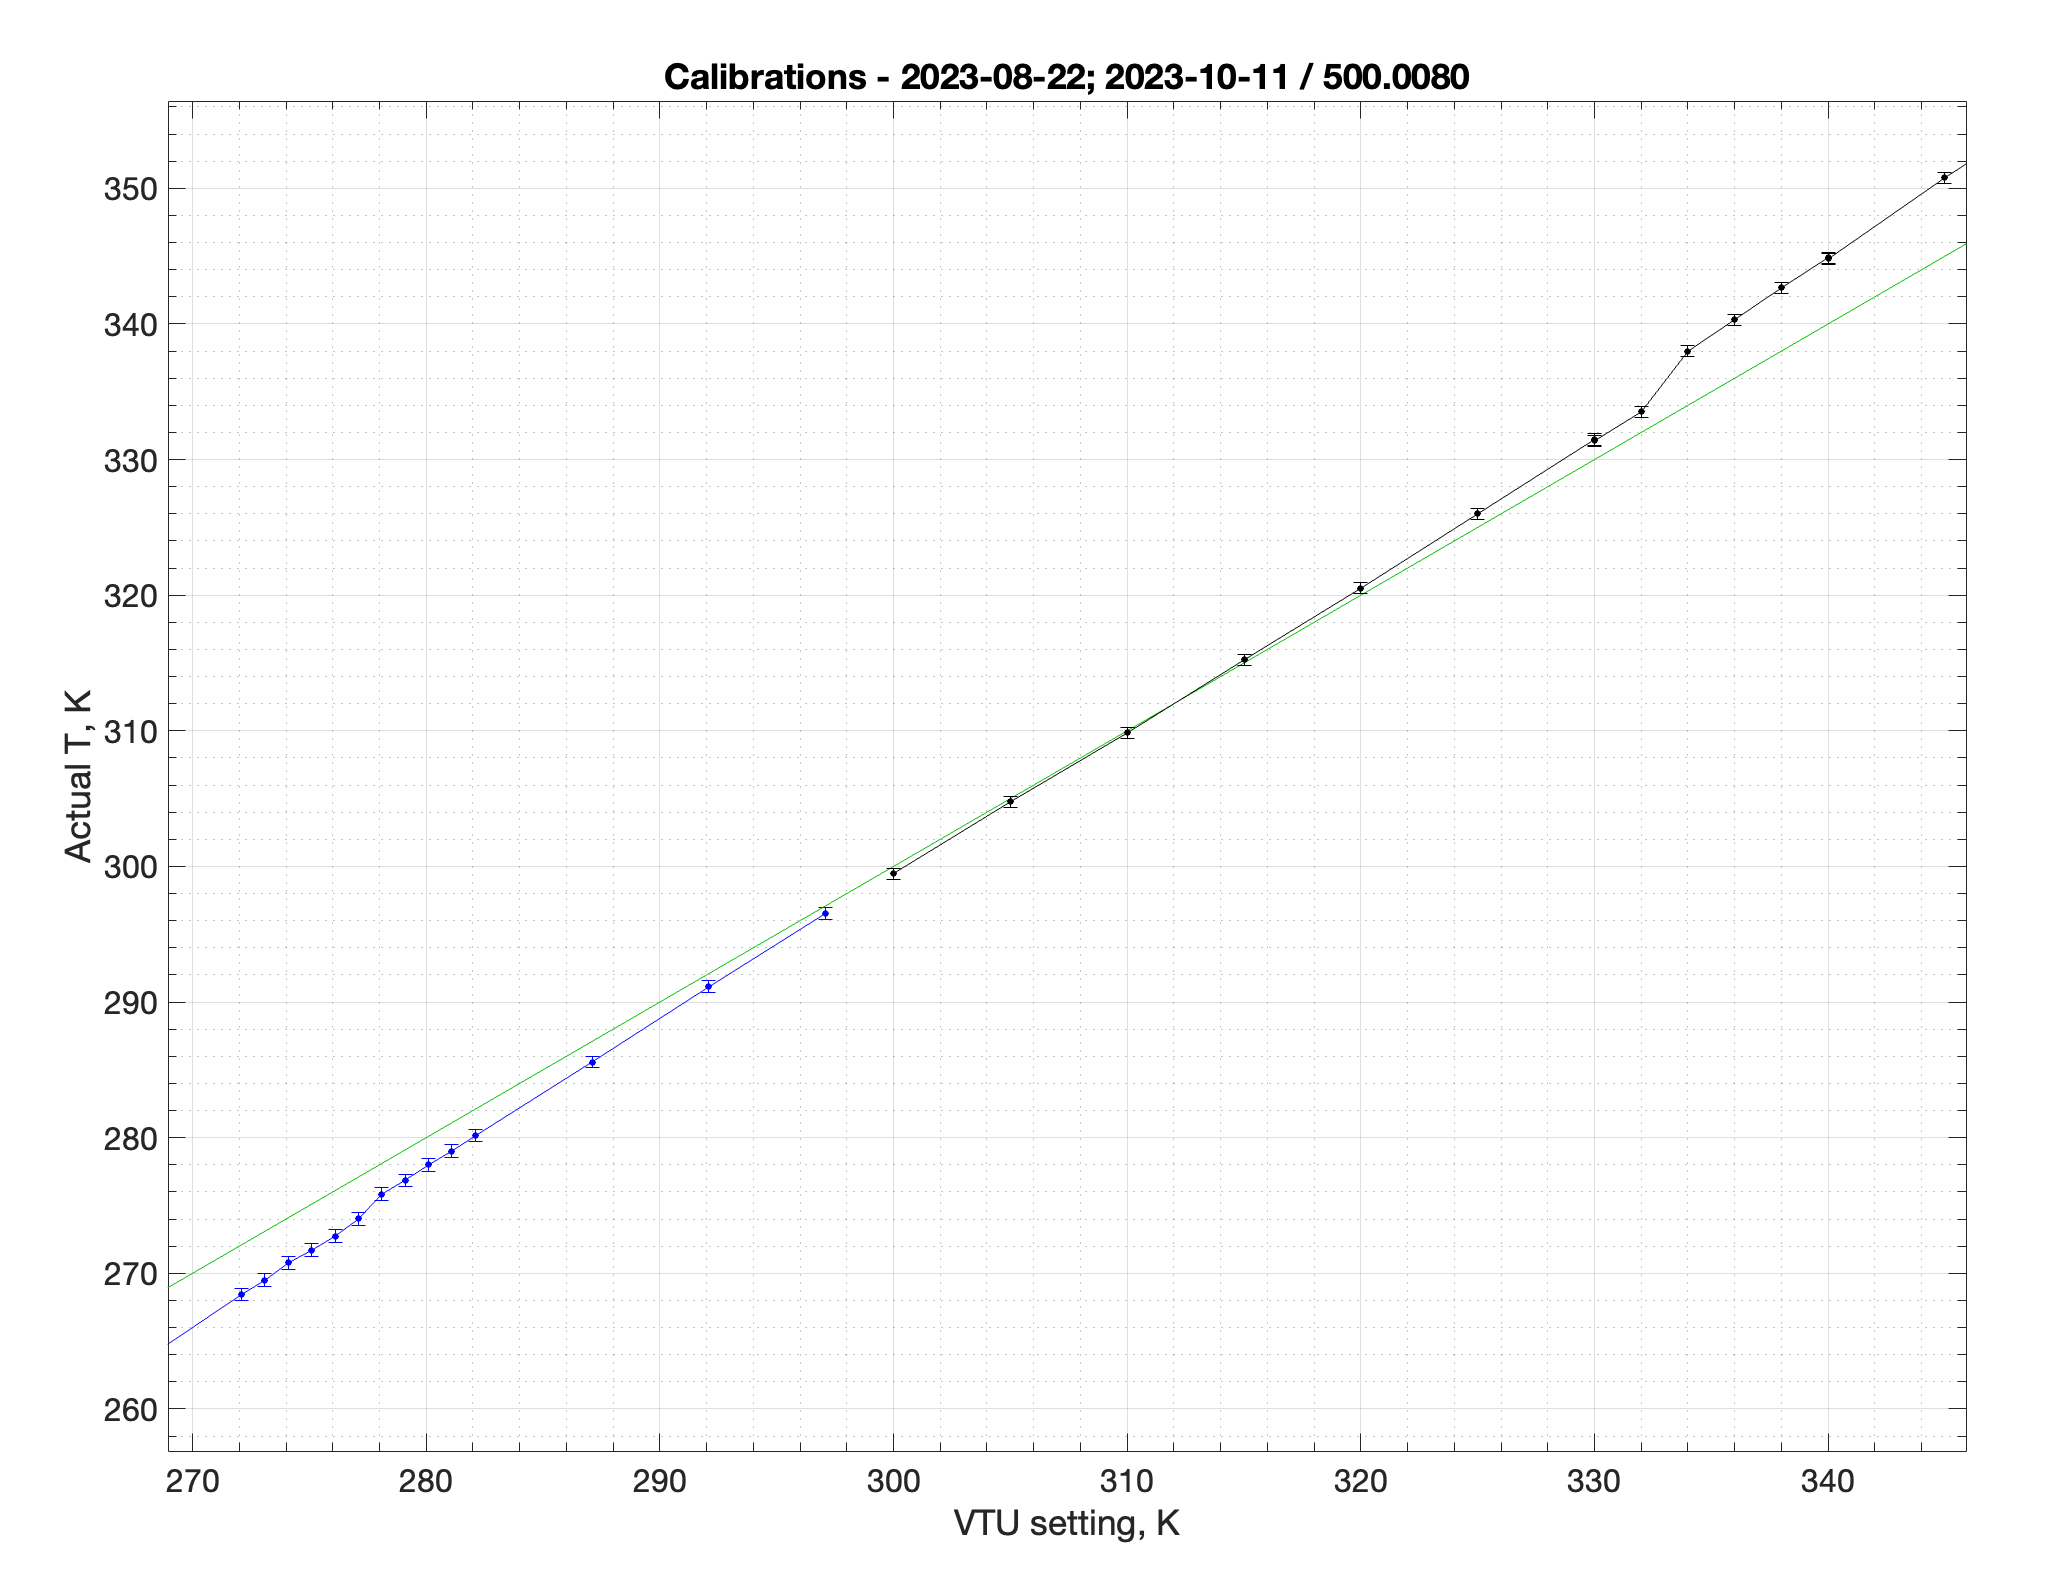
McCourtney 500: Moderate region (including no-trust regions and zoomed center)
McCourtney 500: low-temperature no-trust region
VTU = 277.1 to 278.1, which results in a "dead region" of inaccessible T (real) = 274 K to 275.6K
McCourtney 500: Low-temperature branch
Blue and red points on the low-temp end show methanol methyol doublet: the upfield methanol peak splits below 260; the difference in calculated temperaturs is one degree. Choose the middle point between the two for your real temperature reading.
 |